
Updated: 16 October 2026
The Laffer curve says that tax revenue is zero at a 0% tax rate and also at a 100% rate, so somewhere in between there is a rate that raises the most money. Above that point, a tax cut could raise revenue rather than reduce it. The idea is simple and correct in principle; the hard question, debated for five decades, is where that peak actually sits.
This explainer covers where the Laffer curve came from, how economists estimate the revenue-maximising rate, what real tax cuts have shown, and why politicians and economists so often talk past each other about it.
Table of Contents
What Is the Laffer Curve?
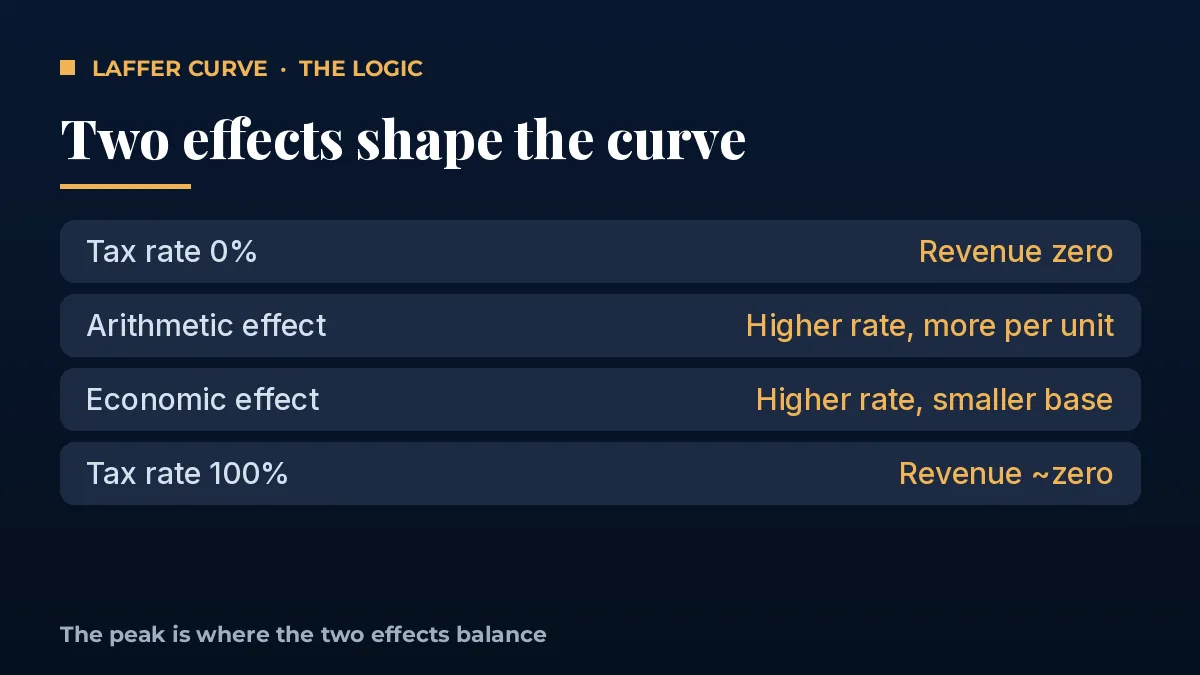
Picture a hill. On the horizontal axis is the tax rate, from 0% to 100%. On the vertical axis is the revenue the government collects. At 0%, the state collects nothing because it taxes nothing. At 100%, it also collects close to nothing, because no one has a reason to earn, declare or report taxable income that is fully confiscated.
Between those two ends, revenue rises and then falls. The top of the hill is the revenue-maximising rate. To the left of the peak, raising the rate increases revenue. To the right of the peak, which economists call the “prohibitive range”, raising the rate actually reduces revenue.
Two forces drive the shape. The arithmetic effect is mechanical: a higher rate collects more from each rupee or dollar of the existing tax base. The economic effect works the other way: a higher rate shrinks the tax base, because people work less, invest less, shift income to other forms or avoid and evade tax. The peak is where those two effects exactly balance.
Origins: A Napkin, a Dinner and an Old Idea
The curve is named after economist Arthur Laffer. According to the widely told story, Laffer sketched it on a napkin in 1974 at a Washington dinner attended by Dick Cheney, Donald Rumsfeld and journalist Jude Wanniski. Wanniski popularised the drawing and named it after Laffer.
However, the idea is much older. The 14th-century scholar Ibn Khaldun observed that low tax rates at the start of a dynasty produced large revenues, while high rates later produced small ones. John Maynard Keynes also wrote that taxation could be so high that it defeats its own object. Laffer himself has said he did not invent the concept; he gave a long-standing insight a memorable picture.
What made the Laffer curve famous was timing. In the late 1970s, US top marginal income tax rates were 70%, inflation was high, and “supply-side economics” offered an argument that lower rates could pay for themselves. That argument shaped the 1981 Reagan tax cuts.
Where Is the Peak of the Laffer Curve?
Everyone accepts that a peak exists. The real debate is its location, and that depends on one measurable number: how strongly taxable income responds to the tax rate. Economists call this the elasticity of taxable income.
A well-known formula from public finance links the two. If the elasticity is low, people do not change behaviour much, and the revenue-maximising rate is high. If the elasticity is high, the peak is lower. In their 2011 paper in the Journal of Economic Perspectives, Peter Diamond and Emmanuel Saez used this approach to estimate a revenue-maximising top income tax rate of about 73% for the United States, once state and payroll taxes are included.
Other research reaches similar conclusions for broad taxes. Mathias Trabandt and Harald Uhlig, in a 2011 study of the US and the EU-14, found that the US was well to the left of the peak for labour taxes, with more room in the US than in several high-tax European economies. Their work also suggested that capital income taxes sit closer to the peak, because capital is more mobile and more responsive.
The key lesson is that there is not one Laffer curve, but many. Each tax, each country and each group of taxpayers has its own curve. A tax on highly mobile capital or on top earners who can shift income may have a lower peak than a broad tax on wages.
What Real Tax Cuts Show
Real-world episodes are the best test of the Laffer curve, though none is a clean experiment.
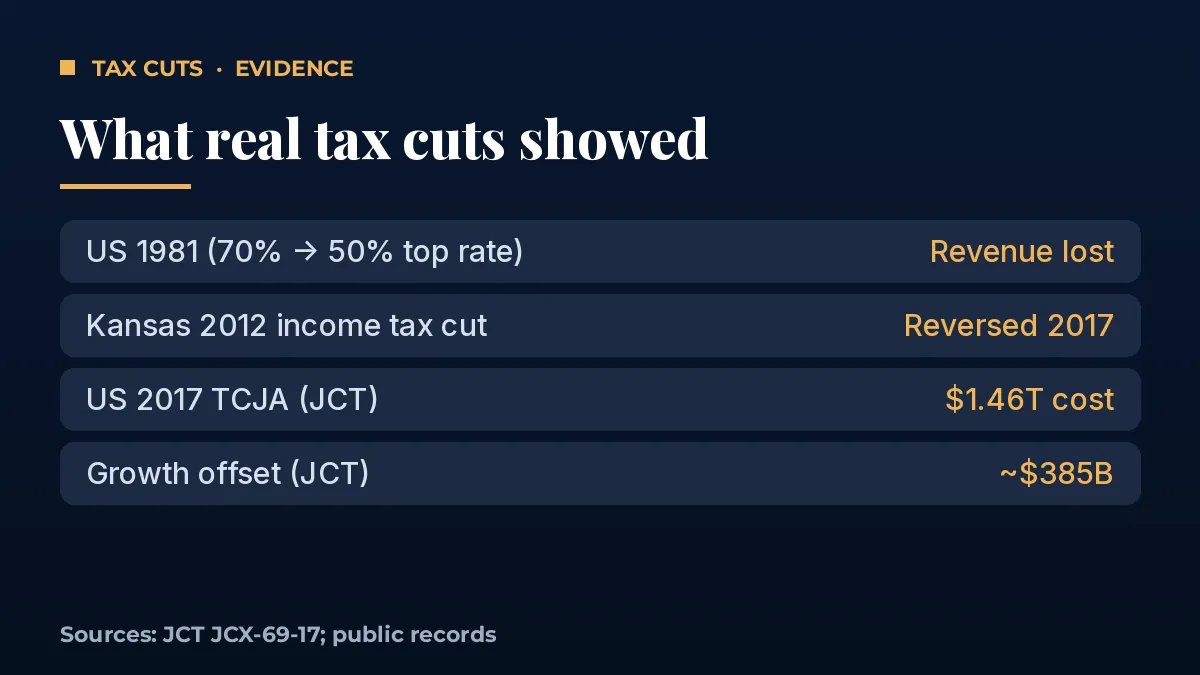
- United States, 1981: The Economic Recovery Tax Act cut the top income tax rate from 70% to 50%, and later reforms cut it further. Federal revenue did not rise enough to offset the cuts, and deficits widened through the 1980s. Most economists conclude the broad cuts lost revenue overall, although behaviour among top earners did shift.
- Kansas, 2012: The state cut income taxes sharply and exempted certain business income, on the promise of faster growth. Revenue fell short, budget gaps followed, and the legislature reversed much of the plan in 2017.
- United States, 2017: The Joint Committee on Taxation estimated the Tax Cuts and Jobs Act would cost about $1.46 trillion over ten years on a conventional basis. its macroeconomic analysis found that extra growth, net of higher interest costs, would offset roughly $385 billion of that, so the law did not pay for itself.
In short, broad tax cuts from moderate starting rates have generally lost revenue. That is consistent with the Laffer curve: those economies were on the left side of the hill, where cutting rates reduces revenue.
When the Laffer Curve Logic Does Work
That said, there are clear cases where lowering a rate can raise revenue. They usually involve a narrow tax base that is very sensitive to the rate.
First, taxes on capital gains realisations. Investors can choose when to sell. A temporary cut can trigger a burst of sales and a short-term revenue jump, even if long-run revenue is lower. Second, very high rates on mobile income. When top rates were above 90% in several countries after World War II, many high earners used shelters and avoidance, so the revenue gained from the top bracket was small. Third, customs duties and excise taxes that drive trade into smuggling or grey markets. Lower duties can bring trade back into the taxed system.
India’s experience with tax administration is often cited in this context. Simpler rates combined with better enforcement and digital reporting can widen the base. However, economists generally attribute such gains mainly to compliance and administration rather than to the rate cut alone.
Why the Debate Never Ends
The Laffer curve debate persists because it mixes a sound idea with a contestable claim. The sound idea is that tax rates affect behaviour, so revenue estimates should include behavioural responses. Modern budget agencies already do this through “dynamic scoring”.
The contestable claim is that a specific tax cut will pay for itself. That claim requires the economy to be on the right side of the peak for that tax. For broad income taxes in most advanced economies, the evidence suggests it is not.
There is also a values question hidden inside the debate. The revenue-maximising rate is not necessarily the right rate. A government might choose a lower rate to encourage enterprise, or a higher rate below the peak to reduce inequality. The Laffer curve only tells you the maximum revenue you can raise; it does not tell you what you should raise.
Five Insights on the Laffer Curve
- The peak exists, but its location is empirical. It depends on the elasticity of taxable income.
- There are many curves. Each tax and group of taxpayers has its own revenue-maximising rate.
- Broad cuts from moderate rates usually lose revenue. The 1981 US, 2012 Kansas and 2017 US experiences point the same way.
- Narrow, mobile bases are different. Capital gains and very high top rates can sit near or past the peak.
- Revenue is not the only goal. Growth, fairness and simplicity also shape tax policy.
What Happens Next
Tax debates around the world in 2026 are being shaped by high public debt and higher interest costs. That makes the revenue question more important, not less. Expect the Laffer curve to keep appearing in arguments about top income rates, corporate taxes and capital gains, and expect budget offices to keep using dynamic scoring to test the claims.
To go deeper, read our explainers on the fiscal multiplier and government spending, fiscal deficits versus government debt, the crowding-out effect of sovereign borrowing, and classical versus Keynesian economics.
Frequently Asked Questions
What does the Laffer curve show?
The Laffer curve shows how government tax revenue changes as the tax rate moves from 0% to 100%. Revenue is zero at both ends and highest at some rate in between. Below the peak, higher rates raise more revenue. Above the peak, higher rates raise less revenue because the tax base shrinks.
Do tax cuts pay for themselves?
Usually not. Tax cuts pay for themselves only when the tax is on the right side of the Laffer curve’s peak. Evidence from the 1981 and 2017 US tax cuts and Kansas in 2012 shows that broad cuts from moderate rates lost revenue, even after allowing for extra growth.
What is the revenue-maximising tax rate?
It depends on how strongly taxable income responds to rates. Diamond and Saez (2011) estimated about 73% for the US top income tax rate, including state and payroll taxes. Rates for mobile capital income are likely lower. No single number applies to every tax or country.
Who invented the Laffer curve?
Arthur Laffer popularised it in 1974, reportedly sketching it on a napkin at a Washington dinner. Journalist Jude Wanniski named it after him. The underlying idea is older, appearing in the writing of Ibn Khaldun in the 14th century and later in John Maynard Keynes.
Is the Laffer curve still relevant in 2026?
Yes. With high government debt in many countries, governments need accurate revenue estimates. Budget agencies use dynamic scoring, which applies Laffer curve logic by including behavioural responses. The curve remains a useful framework, even though the claim that cuts pay for themselves rarely holds.
Sources
- Diamond and Saez (2011), “The Case for a Progressive Tax”, Journal of Economic Perspectives
- Joint Committee on Taxation, macroeconomic analysis of the 2017 tax act (JCX-69-17)
- Trabandt and Uhlig, “The Laffer Curve Revisited” (NBER)
- IMF Finance & Development: tax policy articles
Disclaimer: This article is for education only and does not recommend any tax policy or investment.