Introduction to the Phillips Curve
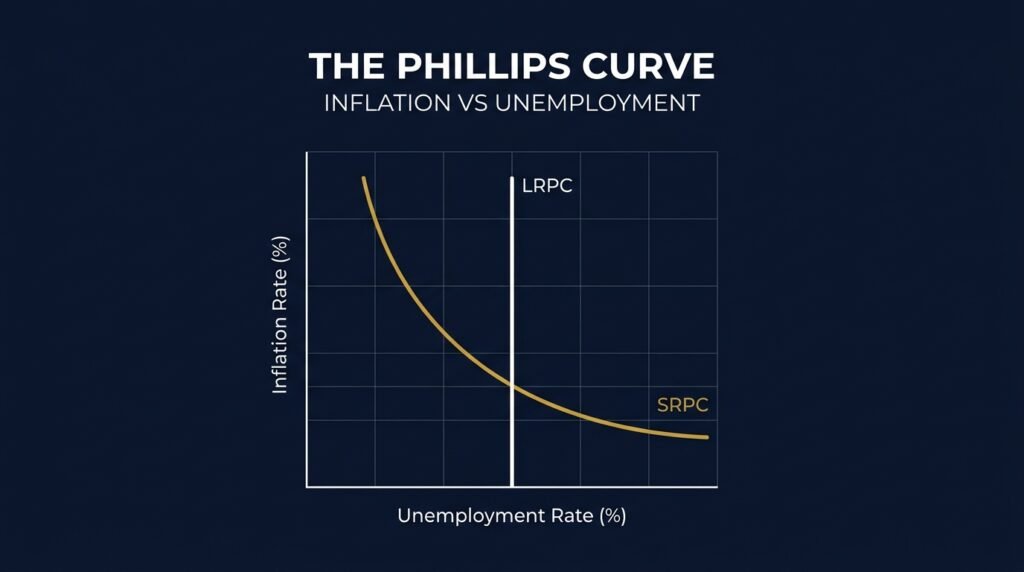
In 1958, A.W. Phillips published a paper observing a robust inverse relationship between wage inflation and unemployment in the UK. This empirical observation evolved into the Phillips Curve, a cornerstone of macroeconomic policy. It suggested policymakers faced a menu of choices: they could accept higher inflation to achieve lower unemployment, or tolerate higher unemployment to secure price stability.
The Expectations-Augmented Phillips Curve
During the stagflation of the 1970s, the original Phillips Curve broke down as both inflation and unemployment rose simultaneously. Milton Friedman and Edmund Phelps independently recognized a critical flaw: the original curve ignored inflation expectations.
The modern, expectations-augmented Phillips Curve is expressed as: $$ \pi = \pi^e – \beta(u – u^n) + v $$
Where: $\pi$ = Actual inflation; $\pi^e$ = Expected inflation; $u$ = Actual unemployment; $u^n$ = Natural rate of unemployment (NAIRU); $\beta$ = Responsiveness of inflation to unemployment; $v$ = Supply shocks.
Worked Example: The NAIRU
Assume expected inflation ($\pi^e$) is anchored at 2%. The natural rate of unemployment ($u^n$) is 5%. $\beta$ is 0.5. There are no supply shocks ($v=0$).
If the government artificially pushes unemployment down to 3% ($u=3$), short-run inflation becomes: $$ \pi = 2\% – 0.5(3\% – 5\%) = 2\% – 0.5(-2\%) = 2\% + 1\% = 3\% $$
In the short run, unemployment is lower, but inflation rises to 3%. However, workers eventually realize prices are rising and adjust their expectations ($\pi^e$) to 3%. The curve shifts up. If the government insists on keeping unemployment at 3%, inflation will rise infinitely. Therefore, in the long run, there is no trade-off: the Long-Run Phillips Curve (LRPC) is vertical at the natural rate of unemployment ($u^n$).
The “Flattening” of the Phillips Curve
In the decades leading up to COVID-19, economists observed that the short-run Phillips curve had “flattened” (the $\beta$ coefficient approached zero). Despite record-low unemployment in the late 2010s, inflation barely budged. Explanations for this flattening included highly credible central banks anchoring expectations, globalization providing cheap imported goods, and declining union power weakening wage negotiations.
Frequently Asked Questions
What is NAIRU?
NAIRU stands for the Non-Accelerating Inflation Rate of Unemployment. It is the specific level of unemployment that does not cause inflation to accelerate. It represents frictional and structural unemployment in a healthy economy.
Is the Phillips Curve dead?
The post-pandemic inflation surge proved the Phillips Curve is merely “hibernating,” not dead. Extreme labor shortages (low $u$) combined with supply shocks ($v$) caused rapid wage and price inflation, perfectly aligning with the augmented Phillips model.