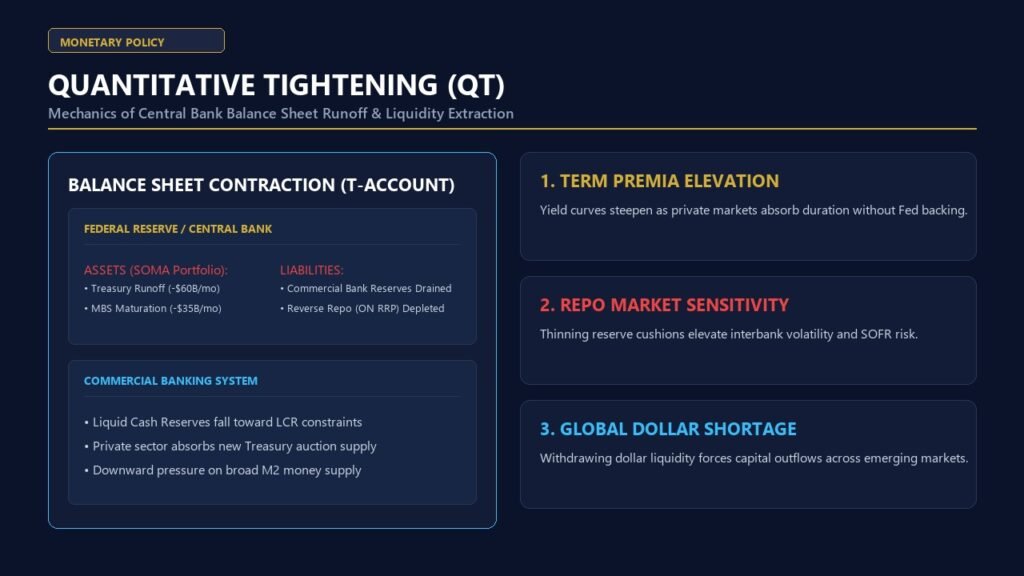
Executive Definition: Quantitative tightening explained simply is an unconventional monetary policy tool whereby a central bank contracts the size of its balance sheet by reducing its holdings of government bonds and mortgage-backed securities. Functioning as the operational mirror image of Quantitative Easing (QE), QT withdraws base money from the commercial banking system, drains central bank reserves, elevates term premia on long-dated sovereign debt, and tightens broader financial conditions to combat persistent demand-driven inflation.
For more than a decade following the Global Financial Crisis of 2008, the world’s major central banks—chief among them the Federal Reserve, the European Central Bank (ECB), and the Bank of England—relied on massive asset purchases to push down long-term interest rates and stimulate sluggish economic growth. However, when post-pandemic supply chokepoints and unprecedented fiscal stimulus ignited 40-year-high inflation, central banks confronted the inverse necessity: dismantling their multi-trillion-dollar balance sheets without detonating underlying repo markets or destabilizing commercial banks. Today, understanding quantitative tightening explained through first-principles balance sheet accounting is indispensable for institutional fixed-income allocators, banking risk officers, and macroeconomists.
Table of Contents
- 1. Core Mechanics: Passive Runoff vs. Active Asset Sales
- 2. Double-Entry T-Account Accounting: Where Does the Money Go?
- 3. The Liability Side: Bank Reserves vs. The Reverse Repo Facility (ON RRP)
- 4. Impact on Term Premia, Yield Curves, and Borrowing Costs
- 5. Worked Empirical Example: Calculating a $95 Billion Monthly Cap
- 6. Financial Plumbing Fragility: The 2019 “Repo Crisis” Lessons
- 7. Comparative Matrix: Quantitative Easing (QE) vs. Quantitative Tightening (QT)
- 8. Emerging Market and Global Spillovers: The Dollar Shortage
- 9. Frequently Asked Questions (FAQ)
- 10. Authoritative References & Primary Sources
1. Core Mechanics: Passive Runoff vs. Active Asset Sales
Central banks execute balance sheet reduction through two primary operational modalities:
- Passive Balance Sheet Runoff (Reinvestment Caps): Under passive QT, the central bank does not sell bonds directly into the secondary market. Instead, it allows a pre-determined volume of maturing sovereign bonds and agency Mortgage-Backed Securities (MBS) to expire without reinvesting the principal proceeds. If maturing debt in a given month falls below the monthly cap (e.g., $60 billion in Treasuries and $35 billion in MBS under the Federal Reserve’s 2022–2024 framework), the full amount rolls off. If maturing debt exceeds the cap, the excess principal is reinvested into newly issued debt.
- Active Outright Asset Sales: In an active QT regime, the central bank conducts competitive reverse auctions, selling long-duration bonds directly to primary dealers in the open market. While passive runoff proceeds quietly in the background (“watching paint dry,” in Janet Yellen’s famous phrasing), active sales apply direct downward price pressure on bonds, sharply spiking yields and steepening the sovereign term structure. The Bank of England has utilized active gilt sales, whereas the Federal Reserve has historically preferred passive runoff.
2. Double-Entry T-Account Accounting: Where Does the Money Go?
A widespread misconception is that the central bank “destroys” currency when conducting QT. In modern fiat accounting, the process is an exact destruction of matching central bank assets and liabilities through the double-entry bookkeeping of the monetary system.
Consider the complete settlement cycle when the U.S. Department of the Treasury redeems a maturing $1,000 bond held by the Federal Reserve, financed by issuing a new $1,000 bond to a private non-bank institutional investor:
- Step 1: The Private Investor Buys New Treasury Debt: The non-bank investor purchases a newly issued $1,000 Treasury bill, drawing down their commercial bank deposit by $1,000.
- Step 2: Commercial Bank Settlement: The commercial bank transfers $1,000 of its central bank reserve balance at the Fed to the Treasury’s general account (the Treasury General Account, or TGA). Commercial bank liabilities (deposits) contract by $1,000, and commercial bank assets (reserves) contract by $1,000.
- Step 3: Treasury Redeems Maturing Bond at the Central Bank: The Treasury uses its $1,000 TGA balance to repay the principal of the maturing bond held by the Fed.
- Step 4: Central Bank Balance Sheet Extinguishment: On the Federal Reserve’s balance sheet, Assets (U.S. Treasury Securities) decline by $1,000, and Liabilities (Treasury General Account) decline by $1,000.
The net outcome across the financial system is unambiguous: $1,000 of central bank assets and $1,000 of commercial bank reserves/deposits have vanished from existence. Total systemic liquidity has been permanently extinguished, reducing the supply of money available to fund asset markets, commercial lending, and financial speculation.
3. The Liability Side: Bank Reserves vs. The Reverse Repo Facility (ON RRP)
While the asset side of the central bank shrinks predictably along the schedule of maturing bonds, the transmission on the liability side is non-linear and presents severe structural risks.
The primary liabilities of the central bank consist of:
- Commercial Bank Reserve Balances: Cash held by regulated deposit-taking banks at the central bank, which forms the regulatory liquidity buffer required under Basel III (Liquidity Coverage Ratio – LCR).
- The Overnight Reverse Repo Facility (ON RRP): Cash parked overnight by non-bank financial intermediaries—primarily money market mutual funds (MMFs) and Government Sponsored Enterprises (GSEs)—in exchange for sovereign collateral.
- The Treasury General Account (TGA): The operating checking account of the national government.
During the initial phase of QT (2022–2023 in the United States), balance sheet reduction was remarkably benign because the drainage occurred almost entirely out of the ON RRP facility rather than commercial bank reserves. Because newly issued Treasury bills offered higher yields than the Federal Reserve’s ON RRP offering rate, Money Market Funds withdrew cash from the ON RRP and bought Treasury bills. Consequently, bank reserves remained abundant above $3.2 trillion.
However, once the ON RRP approaches exhaustion (collapsing from over $2.5 trillion in late 2022 to below $300 billion), every additional dollar of QT directly drains commercial bank reserves. When bank reserves fall below the “Lowest Comfortable Level of Reserves” (LCLoR), interbank liquidity dries up, triggering sudden spikes in overnight lending benchmarks.
4. Impact on Term Premia, Yield Curves, and Borrowing Costs
While policy rate hikes (such as increasing the federal funds target rate or the RBI repo rate) act directly on short-term money market rates, quantitative tightening explained operates predominantly across the long end of the sovereign yield curve.
By stepping back as an active, price-insensitive buyer of long-duration debt, the central bank forces sovereign treasuries to place immense volumes of bonds into the hands of private, price-sensitive investors. To induce private asset managers, pension funds, and foreign buyers to absorb this paper, bond prices must fall, which mechanically pushes long-term yields higher.
In quantitative terms, economists decompose long-term government bond yields into expected short rates plus the term premium ($TP_t$):
y_t^{(n)} = \frac{1}{n}\sum_{i=0}^{n-1} E_t(r_{t+i}) + TP_t^{(n)}
Empirical econometric research by the Federal Reserve Bank of New York indicates that a $1 trillion contraction in central bank sovereign asset holdings elevates the 10-year term premium by approximately 15 to 25 basis points. This structural increase in term premia raises the benchmark discount rate across corporate credit, municipal bonds, and 30-year fixed residential mortgage rates, reinforcing the macroeconomic transmission of monetary policy tightening.
5. Worked Empirical Example: Calculating a $95 Billion Monthly Cap
To evaluate the real-world scale of balance sheet shrinkage, examine the Federal Reserve’s peak runoff parameters enacted between June 2022 and May 2024:
- U.S. Treasury Monthly Cap: $60.0 billion.
- Agency Mortgage-Backed Securities (MBS) Cap: $35.0 billion.
- Maximum Annualized Runoff Capacity: $(60 + 35) \times 12 = \$1.14 \text{ trillion per year}$.
However, realized runoff frequently diverges from theoretical caps due to the structural nature of mortgages. Because existing homeowners locked in sub-3.5% mortgage rates during the pandemic, refinancing activity collapsed to historic lows as mortgage rates climbed above 7.0%. As a result, principal prepayments on agency MBS slowed dramatically, averaging only $15 to $18 billion per month—well below the $35 billion monthly cap.
Despite this shortfall, total Fed balance sheet assets shrank from an all-time peak of approximately $8.96 trillion in April 2022 to roughly $7.15 trillion by late 2024—a net contraction of over $1.8 trillion in base money liquidity, representing the most aggressive monetary contraction in modern history.
6. Financial Plumbing Fragility: The 2019 “Repo Crisis” Lessons
Central banks face a severe operational limit when conducting QT: they do not know with mathematical certainty where the threshold of reserve scarcity lies until the financial system breaks.
This fragility was demonstrated during the September 2019 Repo Crisis. During the Federal Reserve’s prior QT cycle (2017–2019), policymakers believed commercial banks could operate comfortably with reserves as low as $1.0 trillion. However, on September 16–17, 2019, a corporate tax payment deadline coincided with a heavy settlement of Treasury debt auctions. As cash drained from the banking system, major money-center banks refused to lend into the interbank repo market due to internal liquidity stress tests.
Overnight repo borrowing rates, normally pegged to the federal funds target (then ~2.0%), surged to an astronomical 10.00% intraday. The Secured Overnight Financing Rate (SOFR) jumped, freezing credit across Wall Street primary dealers. The Fed was forced to abort QT immediately, inject hundreds of billions in emergency liquidity, and establish the Standing Repo Facility (SRF) as a permanent backstop. Today, monetary authorities carefully monitor money market spreads to prevent a repetition of the 2019 liquidity seizure.
7. Comparative Matrix: Quantitative Easing (QE) vs. Quantitative Tightening (QT)
| Policy Dimension | Quantitative Easing (QE) | Quantitative Tightening (QT) |
|---|---|---|
| Primary Economic Objective | Stimulate aggregate demand, lower long-term yields, avert deflation. | Withdraw excess base liquidity, cool inflation, restore term premia. |
| Balance Sheet Action | Active expansion by purchasing sovereign debt and private assets. | Passive runoff or active outright sales of central bank assets. |
| Systemic Reserves Impact | Injects base bank reserves; expands commercial bank deposits. | Drains bank reserves; contracts broad money (M2) growth. |
| Impact on Sovereign Spreads | Compresses sovereign term premia and corporate credit spreads. | Elevates sovereign term premia; widens high-yield credit spreads. |
| Key Systemic Vulnerability | Asset price bubbles, wealth inequality, debt monetization moral hazard. | Interbank repo market volatility, bank reserve exhaustion, market illiquidity. |
8. Emerging Market and Global Spillovers: The Dollar Shortage
Because the U.S. Dollar serves as the global reserve currency, American Quantitative Tightening generates powerful cross-border ripple effects across emerging economies.
As the Federal Reserve shrinks its balance sheet, the global supply of offshore dollar liquidity contracts. Emerging market sovereigns and multinational corporations that borrowed in U.S. Dollars face a sharp escalation in debt servicing costs. Simultaneously, higher risk-free yields on U.S. Treasuries trigger capital flight away from emerging market equities and bonds, forcing institutions like the Reserve Bank of India (RBI) to actively intervene in foreign exchange markets to prevent disorderly currency depreciation, closely interacting with their broader Balance of Payments and foreign exchange reserve management.
9. Frequently Asked Questions (FAQ)
Q1: What is the main difference between raising interest rates and quantitative tightening?
Raising the policy interest rate directly affects short-term borrowing costs (such as interbank lending and prime commercial rates). Quantitative tightening operates on the quantity of base money, shrinking the central bank balance sheet, draining bank reserves, and pushing up long-term bond yields by elevating the term premium.
Q2: Does quantitative tightening cause an economic recession?
QT does not automatically trigger a recession, but it substantially increases macroeconomic downside risks. By removing liquidity, elevating borrowing costs on mortgages and corporate debt, and tightening bank lending standards, QT slows aggregate demand. If combined with aggressive interest rate hikes, it can contribute to a growth contraction, as signaled in yield curve inversion models.
Q3: Why doesn’t the Federal Reserve just sell all its bonds at once?
Active outright sales of hundreds of billions in long-dated bonds would overwhelm private financial markets, causing bond prices to crash, sovereign yields to spike uncontrollably, and mortgage rates to surge to punitive levels. Central banks prefer passive runoff to ensure balance sheet shrinkage remains predictable and orderly.
Q4: How does quantitative tightening end?
QT ends when central bank reserves decline to an optimal operating level—often termed the “ample reserves regime”—where short-term interbank money market rates trade smoothly near the target rate without volatility. When repo rates show early signs of friction or economic activity weakens, the central bank pauses runoff and resumes gradual asset purchases to match economic growth.
Q5: What is the Standing Repo Facility (SRF)?
Established by the Federal Reserve after the 2019 repo crisis, the Standing Repo Facility allows eligible primary dealers and banks to borrow cash overnight against Treasury and agency collateral at a pre-set rate. It serves as an emergency liquidity valve, capping spikes in repo benchmarks during quantitative tightening.
10. Authoritative References & Primary Sources
- Board of Governors of the Federal Reserve System: Plans for Reducing the Size of the Federal Reserve’s Balance Sheet.
- Federal Reserve Bank of New York: Understanding the Term Premium and Central Bank Asset Holdings.
- Bank for International Settlements (BIS): Central Bank Balance Sheet Reduction: Mechanics, Market Dynamics, and Lessons.
- International Monetary Fund (IMF): Global Financial Stability Report: Navigating the Normalization of Central Bank Balance Sheets.
- Bernanke, Ben S.: 21st Century Monetary Policy: The Federal Reserve from the Great Inflation to COVID-19 (W. W. Norton).